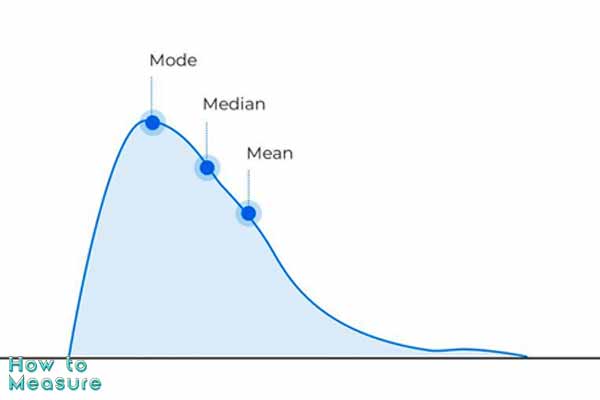
The Mean
The mean (or average) is the sum of the value of each of the data, divided by the total of the analyzed data. Its main utility is to obtain the average of both continuous and discrete data.
There are different types of the mean. However, the most used is the arithmetic mean, above all, due to the simplicity of its application and interpretation. Its formula is as follows:
Σ Xi is the sum of the entire set and n is the totality of the queried data. Then, the quotient between both elements is obtained to find the arithmetic mean.
For example:
In a travel agency it was observed that during a week the following number of people were attended:
- Monday: 10
- Tuesday: 15
- Wednesday: 8
- Thursday: 10
- Friday: 12
What is the average weekly customer service?
For this simple calculation, all you have to do is add the number of people per day and divide it by the 5 days of the week. Namely:
x̄ = 55 / 5
x̄ = 11
Therefore, the mean shows the most common value, which in this specific case was 11. Also, the mean is used as the balance point for the data.
Statistically, the harmonic, geometric, weighted, or quadratic mean can also be applied, depending on the nature of the information.
The Median
The median is another of the most used measures of central tendency. This is the mean value of a data set that divides in half.
The method for finding the median varies slightly depending on whether the grouped data is odd or even.
Though, the first step in finding the median is to sort the data set from smallest to largest and then analyze it accordingly. For example:
Median for Odd Data
Suppose you want to find the median in the following set: 3, 4, 8, 10, 12, 15, 13, 6, 7.
First, they are sorted in ascending order to find the center of the set.
3, 4, 5, 6, 7, 10, 12, 13, 15.
At first glance, the median is 7, since it divides the set into two halves of elements.
Median for Even Data
Now, to find the median in a set of even data, it is only necessary to order them from smallest to largest to take into account the pair of data grouped in the center.
For example:
To obtain the median of 2, 5, 10, 15, 3, 8, the quantities are ordered and the central intermediate value is taken.
2, 3, 5, 8, 10, 15.
Then, the average between 5+8 is calculated, which would be equal to:
5 + 8 / 2 = 6.5.
So, the median in this exercise is 6.5.
The Mode
The mode is the data that is repeated the most within a data set and that offers a clear interpretation of the trend. To calculate the mode, mathematical formulas are not applied, but the data with the most repetitions is observed.
For example:
In the following set: 2, 6, 7, 3, 4, 6, 7, 7, it can be seen that the mode or most repetitive digit is 7.
Why is Measuring Central Tendency Important?
Measures of central tendency are very useful for ordering data systematically. In addition, they give credibility to the information, since they show the possible averages or biases of the data obtained.
Coupled with that, measures of central tendency are essential to summarize the information.
Similarly, these measures are very useful in fields such as marketing, finance, education, and any social field because they express trends in financial or population behavior.
Within the sciences, it is a fundamental strategy for decision-making based on the data obtained.
However, for greater reliability of any study, it is necessary to complement these statistical tools with measures of dispersion. In this way, it is possible to make a more complete study of the variables.
Application Example
Now, a very simple exercise is presented in which the measures of central tendency will be found: mean, median, and mode:
A birthday party was attended by a group of children who are the following ages:
12, 8, 4, 9, 7, 8, 6, 7, 10, 11, 7.
The mean within that data set is as follows:
x̄ = 12 + 8 + 4 + 9 + 7 + 8 + 6 + 7 + 10 + 10 + 7 / 11
x̄ = 8.
For the median, the ages of the children are organized from lowest to highest and the central point is taken:
4, 6, 7, 7, 7, 8, 8, 9, 10, 11, 12.
The median is 8.
In the case of mode, only duplicate values are considered. Specifically, in this set 7 is the most repeated digit, therefore 7 is the mode.
4, 6, 7, 7, 7, 8, 8, 9, 10, 11, 12.
With each of these central trends identified, it is easier to create graphs and tables to visualize the data more quickly.
In this article, you read about how to measure central tendency.


